

MaxiThermal-XYZ Software
allows you to view up to 8 multiple traces at one time, enables you to transfer
the recorded information in your loggers to your computer, and to view, print
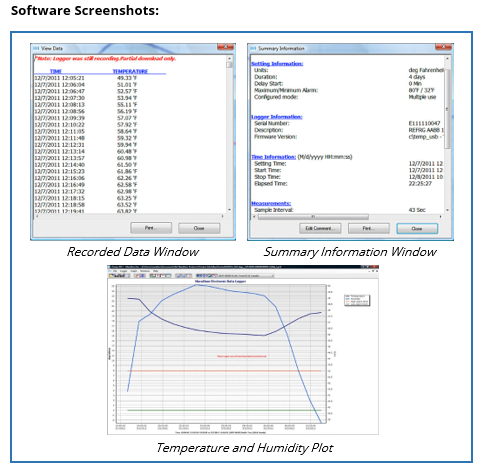
and generate a report of the measurement data. The graphic representations are
a simple X – Y plot of time versus temperature with unlimited zoom, view
temperature data points on the graph, view total elapsed time, or the exact
time when it was recorded. The graph and all data points (date, time and
temperature) can be printed, as well as the ability to add a user note to the
file for including information pertinent to that particular plot.
Users have the ability to view numeric data
in a screen window and data can be exported as a CSV file for use in other
software. Users can also create and print a Summary Information report showing
the specific logger information, the Start and Stop Time, Duration of
Recording, Measurement Interval, Highest, Lowest, Median and Average
Temperatures as well as the High and Low Alarm information.

